

Registered providers with 1,000 or more social housing units must report Tenant Satisfaction Measures (TSM) to the Regulator of Social Housing through NROSH+ by 30 June each year (gov.uk). Neither Qlik nor Power BI submits that return for you; the choice is about the dashboard and benchmarking layer behind it. For most housing associations already running Microsoft 365, Power BI Pro at roughly £10.80 per user a month is the cheaper starting point. Qlik Cloud Analytics earns a serious look once data volumes or self-service ambitions outgrow it.
Key pointers
- NROSH+ is the submission channel for TSM data, not a dashboard tool; you still need somewhere to store, trend and present the 23 measures internally and to tenants (gov.uk).
- The reporting year is fixed at 1 April to 31 March for providers with 1,000-plus units, with a submission deadline of 30 June, so a new dashboard build has a hard annual date to be ready for (gov.uk).
- Power BI Pro is priced per user, around £10.80 a month paid yearly (see Fast Facts for the source); Qlik Cloud Analytics is priced by data volume and starts at $300 a month for 10 users and 10GB (Qlik).
- Staff on Microsoft 365 E5 or Office 365 E5 already hold a Power BI Pro licence at no extra cost; staff on E3 or lower plans still need a standalone Pro licence.
- Qlik's associative engine and automation builder suit teams that want to blend TSM results with repairs, asset and finance data without writing separate data models for each view.
- Both platforms can host UK-resident data: Qlik Cloud offers a London region, and Microsoft Fabric/Power BI is available in UK South and UK West (Qlik; Microsoft Learn).
- Ask any supplier for a written quote against your actual headcount and data volume before assuming the advertised entry price is what you will pay at scale.
What Tenant Satisfaction Measures Mean for Your BI Stack
TSM is a set of 23 measures: 12 drawn from tenant perception surveys (TP01 to TP12, covering overall satisfaction, repairs, safety, communication, fairness, complaints, communal areas, neighbourhood and anti-social behaviour) and 11 generated from your own management information (complaints volumes, anti-social behaviour cases, the Decent Homes Standard, repair timescales and six building safety checks, BS01 to BS06) (gov.uk). Providers with 1,000 or more units must report these on a registered group basis for the year running 1 April to 31 March, and submit the whole set through NROSH+ by 30 June (gov.uk; gov.uk).
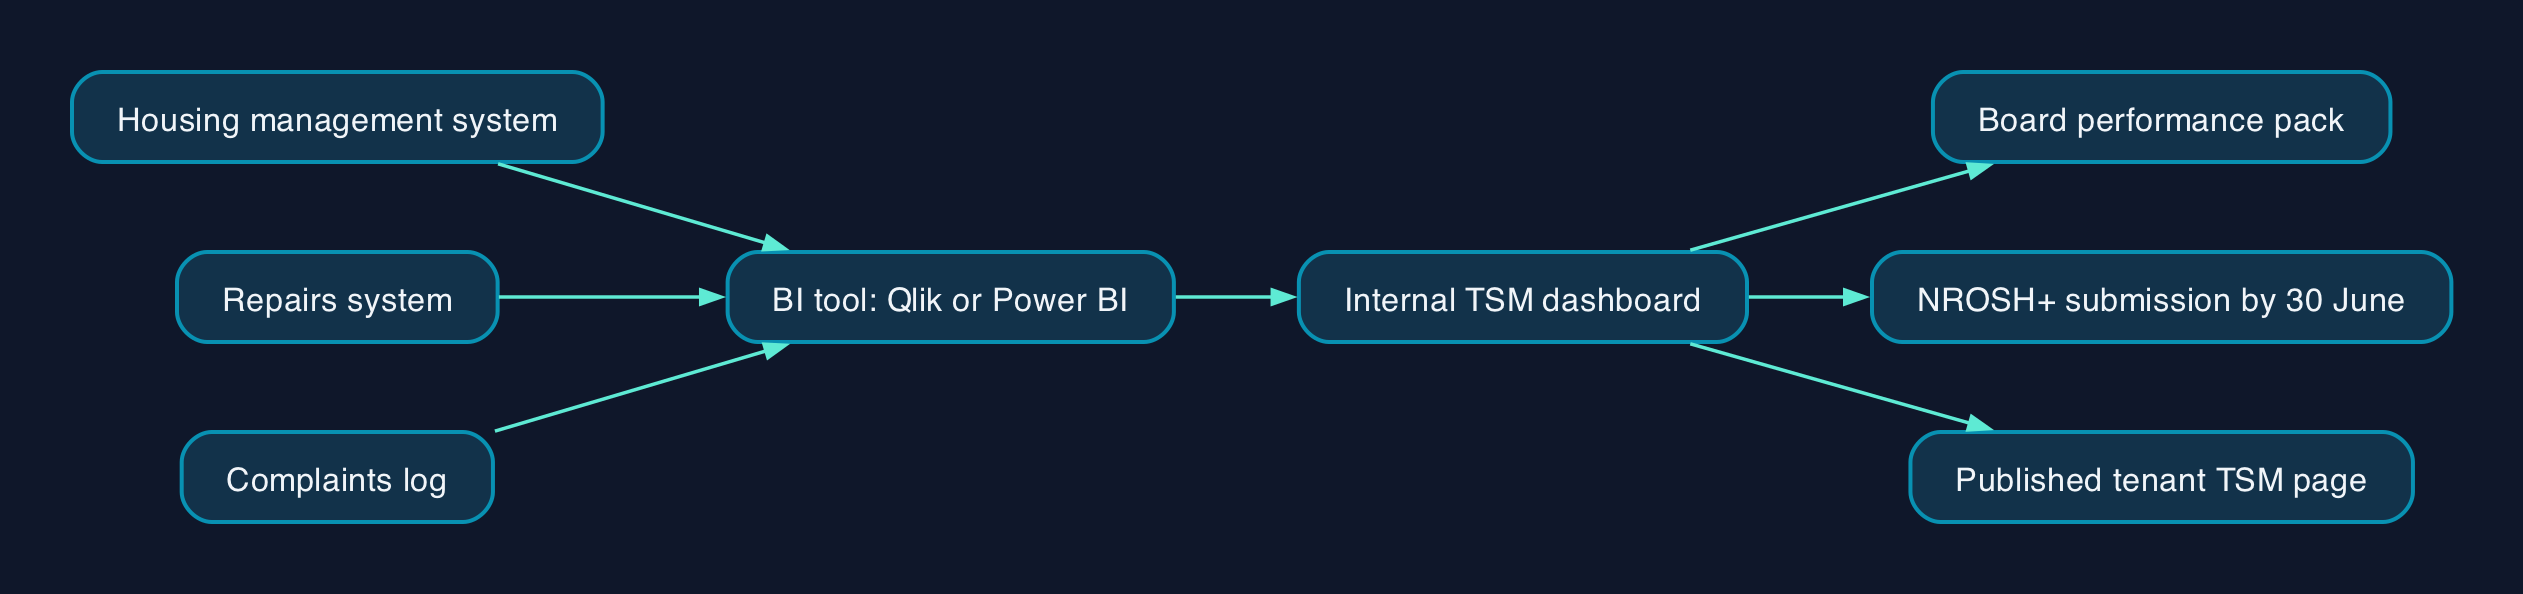
That submission is a template upload, not a live feed from a dashboard. What a BI tool actually does is pull the underlying source data, usually a housing management system, a repairs system and a complaints log, into one model so your team can check figures before submission, track them through the year rather than discovering problems in June, and publish the tenant-facing version required under the Transparency, Influence and Accountability Standard. Sector-wide, that internal visibility matters: the regulator's own 2024/25 figures show median landlord satisfaction ranging from 78% on home safety and fairness down to 36% on complaint handling, with a further gap at 48% for low cost home ownership residents, and a well-built dashboard should flag differences like these early rather than let them surface for the first time in a board pack (gov.uk headline report).
Both Power BI and Qlik Cloud Analytics can do this job. The real decision is less about raw charting capability, which is broadly comparable on both platforms, and more about who already holds licences, how your data is structured, and how much you expect to spend as you add repairs, asset and finance data alongside TSM figures.
Pricing and Cost Model
Power BI is priced per named user. Qlik Cloud Analytics is priced primarily by data volume, with a fixed small-team entry tier. Neither vendor's published price is a final UK contract price; both exclude VAT and are subject to negotiation at scale.
| Plan | Price | Billing basis | Notes |
|---|---|---|---|
| Power BI Desktop | Free | N/A | Authoring only, no publishing or sharing (Microsoft) |
| Power BI Pro | ~£10.80/user/month | Paid yearly, per named user, excl. VAT | Required for anyone publishing or sharing reports, see Fast Facts for the source |
| Power BI Premium Per User | ~£18.50/user/month | Paid yearly, per named user, excl. VAT | Adds larger model sizes and more frequent refreshes |
| Power BI Premium step-up add-on | £10.80/user/month | Paid yearly, for users who already hold Pro plus Microsoft 365 or Office 365 E5 | Published directly on Microsoft's own pricing page (Microsoft) |
| Qlik Cloud Analytics Starter | $300/month | Billed annually, 10 users, fixed 10GB data | No published GBP price (Qlik) |
| Qlik Cloud Analytics Standard | $825/month | Billed annually, unlimited users, 25GB data | Additional GB sold in 25GB increments (Qlik) |
| Qlik Cloud Analytics Premium | $2,750/month | Billed annually, unlimited users, 50GB data | Adds predictive analytics and anonymous public access (Qlik) |
| Qlik Cloud Analytics Enterprise | Quote-only | Billed annually, 250GB+ data | Multi-region tenants, larger app sizes (Qlik) |
Microsoft raised Power BI Pro and Premium Per User list prices worldwide from 1 April 2025, the first increase since Power BI launched, so budget lines carried over from an older business case will understate the cost (Microsoft Fabric community blog). For a 15-person performance and data team, Power BI Pro comes to roughly £162 a month before VAT; the same headcount on Qlik's Standard tier is $825 a month regardless of user count, provided the 25GB data allowance is enough, which it usually is for TSM plus a moderate volume of repairs data.
The comparison inverts as your BI use expands beyond TSM. Power BI's per-user model means cost rises with every named creator or editor you add across the organisation, which can outstrip Qlik's flat data-volume pricing once dashboards spread into asset management, finance or customer services. Get a written quote against your real headcount and data volumes from both vendors rather than budgeting from the list price alone, and check whether your existing agreement is Microsoft 365 E5 or Office 365 E5, which already includes a Power BI Pro entitlement, before pricing a fresh Pro licence for every user.
Qlik and Power BI Compared
| Criterion | Power BI | Qlik Cloud Analytics |
|---|---|---|
| Pricing model | Per named user (Pro/PPU), or capacity-based Fabric | Per data volume (GB), unlimited users from Standard up |
| Entry cost for a small team | Low if Microsoft 365 already licensed | $300/month fixed for 10 users, regardless of existing licences |
| UK data residency | UK South and UK West Azure regions | Europe (London) region, backup in Madrid |
| Existing skills fit | Familiar to teams already using Excel and Microsoft 365 | Steeper learning curve for the associative engine and scripting |
| Blending TSM with other data | Straightforward with Power Query and Dataverse/Fabric connectors | Strong native fit for combining multiple sources via automation builder |
| Free authoring | Power BI Desktop is free | No free authoring tier; Starter is the minimum paid entry point |
| Scaling to enterprise data volumes | Cost scales with users, not data | Cost scales with data volume, not users; Enterprise tier is quote-only |
| Support | Included support varies by licence tier and Microsoft agreement | 24x7 severity-1 support from Standard tier upward (Qlik) |
For a housing association that already runs Microsoft 365 across its performance, data and communications teams, Power BI Pro is usually the lower-friction and lower-cost route to a TSM dashboard: the authoring tool is free, the per-user licence is comparatively cheap, and staff are often already inside the Microsoft ecosystem. Power BI suits an organisation that wants a small number of named report authors publishing to a wider, mostly read-only, tenant board and staff audience.
Qlik Cloud Analytics is the stronger fit where the association wants unlimited named users from the Standard tier upward, plans to blend TSM figures with repairs, asset condition and complaints data into one associative model, and can absorb a fixed monthly platform cost rather than a per-seat one. It is a poorer fit for an association that only needs a handful of report builders and a lot of passive viewers, since Qlik's viewer-inclusive pricing offers little advantage there and its published prices are USD, not GBP, meaning currency risk sits with the buyer unless a GBP contract is negotiated directly.
Editorial analysis
Neither platform changes what has to be reported. The 22 TSMs, the 1 April to 31 March reporting year and the 30 June NROSH+ deadline are fixed by the regulator regardless of which BI tool sits behind them (gov.uk). The practical question for a performance or data lead is whether the organisation is buying a dashboard for one annual regulatory exercise or a general analytics platform that TSM happens to be the first serious use case for. If it is genuinely just TSM plus a board pack, the lower per-user cost of Power BI Pro, especially where Microsoft 365 is already licensed, is hard to beat on price alone. If the ambition is a shared analytics layer across repairs, asset management, finance and tenant services, Qlik's flat, volume-based pricing and unlimited users from Standard upward can work out cheaper as the number of dashboard consumers grows, provided the data volume stays inside the tier purchased.
Either way, treat the regulator's own technical requirements document, not a supplier's marketing page, as the source of truth for what fields the dashboard needs to hold, since the requirements changed twice in 2026 alone (gov.uk).
Sources
- Annex B: Tenant Satisfaction Measures - publication and submission requirements, Regulator of Social Housing
- Tenant Satisfaction Measures - Technical requirements, Regulator of Social Housing
- Information required from registered providers, Regulator of Social Housing
- Tenant Satisfaction Measures 2024/25 Headline report, Regulator of Social Housing
- Power BI pricing, Microsoft
- Important update to Microsoft Power BI pricing, Microsoft
- Power BI licensing explained: Free vs Pro vs PPU vs Fabric capacity, EasyInsight
- Qlik Cloud Analytics Plans and Pricing, Qlik
- Qlik Cloud Regions, Qlik
- Fabric region availability, Microsoft Learn